
Scope 1 vs Scope 2 vs Scope 3: The One Rule That Explains the Difference
Understand Scope 1, Scope 2 and Scope 3 emissions with simple business examples. Learn the differences, 15 Scope 3 categories, calculation basics and how to build a reliable GHG inventory
 PS Team14 min read
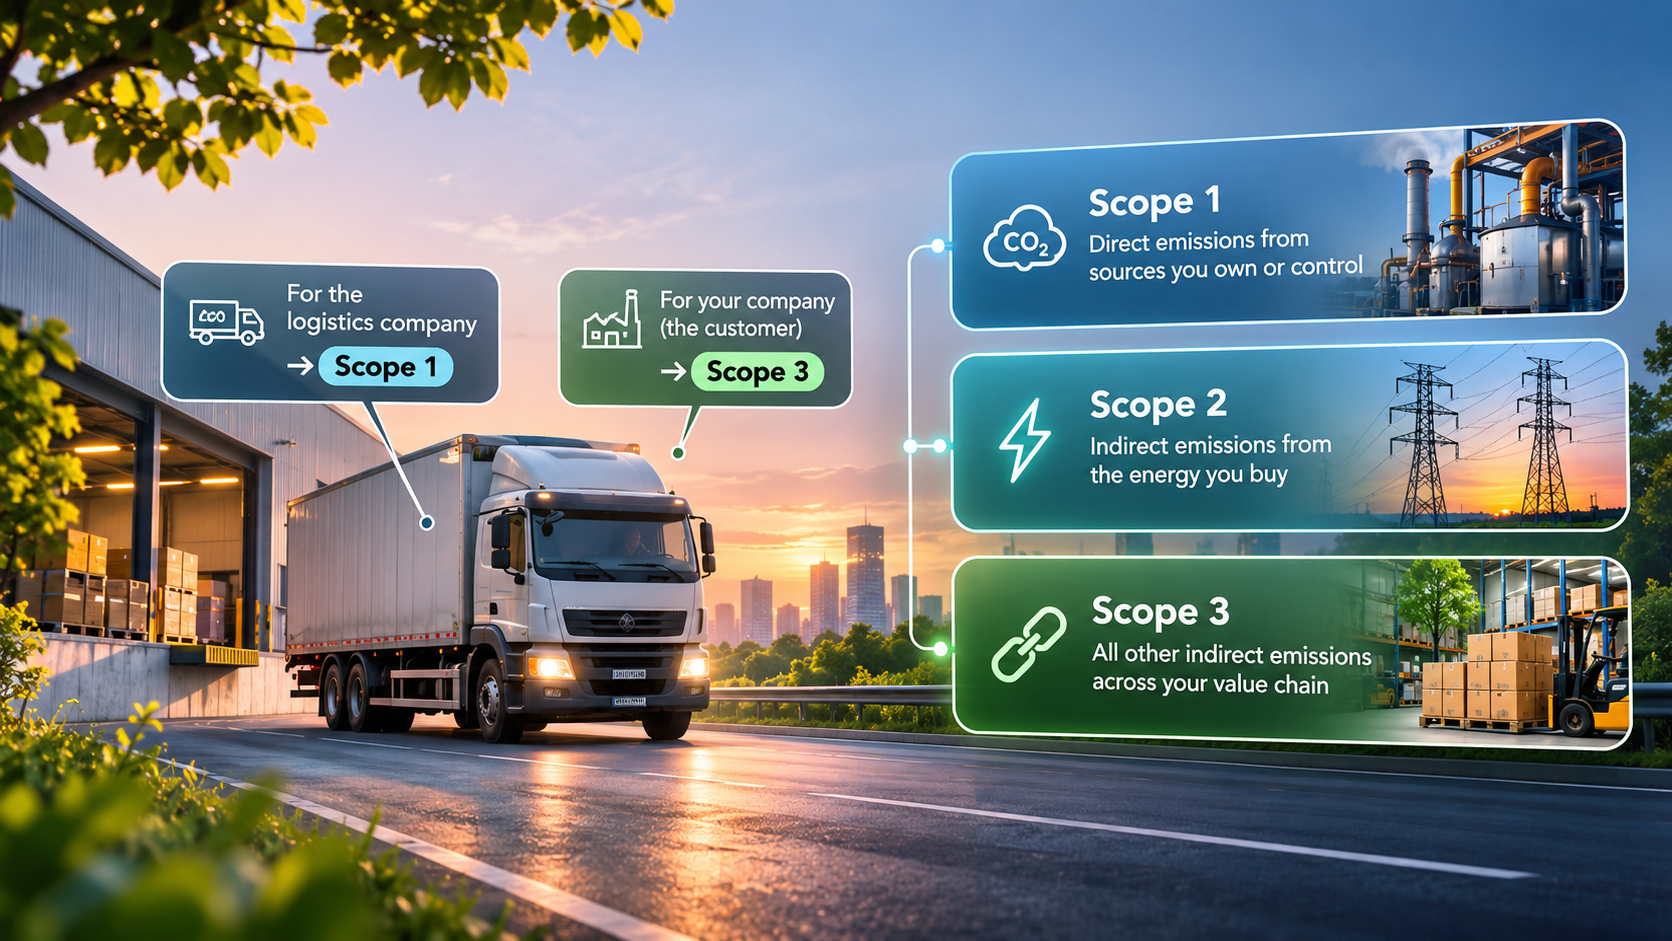
The same diesel truck is Scope 1 for one company and Scope 3 for another. That's not an accounting error.
Picture a logistics company delivering raw materials to your factory. The truck belongs to the logistics company, and so does the diesel. The fuel it burns falls under the logistics company's Scope 1. For you, the customer purchasing that transportation service, the associated emissions generally fall under Scope 3.
Same truck. Same litres of diesel. Different scopes.
Nothing about the truck changed. What changed is the relationship between the emissions source and the organisation reporting them.
This is the idea behind Scope 1, Scope 2 and Scope 3. The GHG Protocol classifies emissions based on the reporting organisation's boundaries and its relationship to the source. It does not classify them simply by whether an activity happens inside or outside your premises.
This guide explains the three scopes through practical examples, the data each one needs, how emissions are calculated and how to build an inventory you can support with evidence.
The one rule behind all three scopes
Every emissions source needs to be assessed from the perspective of the organisation preparing the inventory.
Under the GHG Protocol, emissions fall into three broad categories:
| Scope | What it covers | Your relationship to the source | Typical examples |
|---|---|---|---|
| Scope 1 | Direct emissions | The source is within your organisational boundary under your chosen consolidation approach | Diesel generators, boilers, company-controlled vehicles, refrigerant leaks |
| Scope 2 | Indirect emissions from purchased energy | You purchase or acquire and consume the energy, while another entity generates it | Grid electricity, purchased steam, heating or cooling |
| Scope 3 | All other indirect value chain emissions | The emissions arise from other activities in your upstream or downstream value chain | Purchased materials, third-party freight, business travel, use of sold products |
For Scope 1 and Scope 2, the GHG Protocol allows organisations to define their organisational boundaries using one of three approaches:
- Equity share
- Financial control
- Operational control
Your chosen approach determines which operations and sources sit within your organisational boundary. You need to apply it consistently.
The test is therefore not simply whether an activity happens inside or outside your premises. A leased warehouse, a vehicle or a supplier's truck can fall under different scopes depending on the arrangement and the boundary approach you apply.
Keep this distinction in mind. It helps answer most scope classification questions.
Scope 1: Direct emissions from sources you own or control
Scope 1 covers direct greenhouse gas emissions from sources within your organisational boundary.
Take a manufacturer that operates boilers, uses diesel generators during power cuts, runs its own delivery fleet and has production processes that release CO₂.
The emissions from these sources fall under Scope 1 when they are within the company's organisational boundary.
Scope 1 emissions generally come from four types of sources.
1. Stationary combustion
Fuel burned in equipment that stays in one place.
Examples:
- Diesel used in generators.
- Natural gas used in boilers and furnaces.
- Fuel used in industrial heating equipment.
2. Mobile combustion
Fuel burned in vehicles and other mobile equipment.
Examples:
- Petrol or diesel used in company-controlled cars.
- Fuel used in trucks and operational vehicles.
3. Process emissions
Greenhouse gases released through physical or chemical reactions during production.
Examples:
- CO₂ released during certain industrial processes.
- Emissions from chemical reactions in manufacturing.
4. Fugitive emissions
Unintended releases of greenhouse gases from equipment or operations.
Examples:
- Refrigerant leakage from air-conditioning systems.
- Methane leakage from equipment and pipelines.
A hotel that operates a diesel generator during power cuts produces Scope 1 emissions from the fuel burned. The same applies to a hotel boiler used for hot water, provided the source falls within the hotel's organisational boundary.
What data do you need?
- Diesel, petrol and natural gas consumption.
- Vehicle fuel records.
- Refrigerant purchase and top-up records.
- Records of refrigerant leakage.
- Activity data from emitting production processes.
The accuracy of your Scope 1 inventory depends on the quality of these records. Keep the supporting documents alongside the reported figures.
Scope 2: Indirect emissions from the energy you buy
Scope 2 covers emissions from generating the electricity, steam, heating and cooling your organisation purchases or acquires and consumes.
You consume the energy, but the emissions from generating it occur at the power plant or energy-generation facility.
This is where the reporting perspective becomes important.
A power plant that burns coal or gas reports the resulting emissions under its Scope 1. The organisation purchasing and consuming the electricity reports the associated generation emissions under its Scope 2.
For most businesses, purchased electricity is a major part of Scope 2.
Think about the electricity used for lighting, air conditioning, machinery, computers and other equipment across offices, factories, hotels and warehouses.
A company with five manufacturing facilities needs electricity consumption data from all five locations to calculate its Scope 2 emissions.
Common Scope 2 sources include:
- Electricity purchased from the grid.
- Purchased steam used in manufacturing.
- Purchased heating.
- Purchased cooling.
Two ways to calculate Scope 2
The GHG Protocol Scope 2 Guidance identifies two accounting methods. They provide different views of the emissions associated with purchased electricity.
Location-based method
This method uses the average emissions intensity of the electricity grid where your organisation consumes electricity.
It reflects the emissions associated with the local electricity grid.
Market-based method
This method uses emission factors associated with the electricity products or contractual instruments your organisation purchases, where qualifying data and instruments are available.
Examples include eligible renewable electricity contracts, power purchase agreements and energy attribute certificates. These instruments must meet the GHG Protocol's applicable quality criteria. Simply purchasing a renewable energy certificate does not automatically make every electricity claim valid.
Under the GHG Protocol Scope 2 Guidance, organisations with operations in markets that provide qualifying product- or supplier-specific contractual instruments are required to report both location-based and market-based Scope 2 totals.
What data do you need?
- Electricity bills.
- Monthly electricity consumption.
- Meter readings.
- Purchased steam, heating or cooling data, where applicable.
- Relevant grid emission factors.
- Eligible renewable electricity contracts and certificates, where applicable.
Keep the energy consumption records and supporting contractual evidence together. Both are important when explaining your Scope 2 calculations.
Scope 3: Emissions across your value chain
Scope 3 covers all other indirect emissions in your organisation's value chain that are not included in Scope 2.
These emissions arise from activities connected to your business, both upstream and downstream.
You do not need to own a supplier's factory, operate a logistics company's trucks or control how customers use your products for the associated emissions to fall within your Scope 3 inventory.
The GHG Protocol divides Scope 3 into 15 categories.
| No | Upstream categories | No | Downstream categories |
|---|---|---|---|
| 1 | Purchased goods and services | 9 | Downstream transportation and distribution |
| 2 | Capital goods | 10 | Processing of sold products |
| 3 | Fuel- and energy-related activities not included in Scope 1 or 2 | 11 | Use of sold products |
| 4 | Upstream transportation and distribution | 12 | End-of-life treatment of sold products |
| 5 | Waste generated in operations | 13 | Downstream leased assets |
| 6 | Business travel | 14 | Franchises |
| 7 | Employee commuting | 15 | Investments |
| 8 | Upstream leased assets |
Not every category applies to every company.
A software company might have limited emissions from the processing of sold products. A manufacturer of electrical appliances might have significant emissions from the use of sold products.
The relevant categories depend on your business model and value chain.
An example across all three scopes
Consider a company that manufactures and sells electrical equipment.
Its emissions inventory might include:
- Scope 1: Fuel burned in its own generators and vehicles, along with relevant process and fugitive emissions.
- Scope 2: Emissions associated with purchased electricity consumed at its factories and offices.
- Scope 3: Emissions from producing the raw materials it purchases, transporting those materials, employee business travel, distributing finished products and the use of sold products, where relevant.
The company's emissions inventory therefore extends beyond its own factories and offices.
What data do you need?
- Procurement records with quantities and material types.
- Supplier-specific emissions data, where available.
- Logistics and freight records.
- Business travel and expense data.
- Employee commuting information.
- Waste disposal records.
- Product sales and use-related information, where relevant.
- Data from other relevant value chain partners.
Much of this information sits outside your organisation. That is what makes Scope 3 more demanding to measure and manage.
Back to the truck: One activity, different scopes
The opening example becomes clearer when we look at how transportation is reported.
| Situation | How the emissions are classified |
|---|---|
| Your company owns and operates a diesel truck within its organisational boundary | Fuel combustion is your Scope 1 |
| You purchase a third-party service to transport raw materials to your facility | Generally your Scope 3, Category 4 |
| A logistics provider operates the truck using its own diesel | The provider reports the fuel combustion under its Scope 1 |
| A third party transports your sold products to customers, and you do not pay for that transportation | Generally your Scope 3, Category 9 |
| You purchase a third-party service to transport your sold products | Generally your Scope 3, Category 4 |
| You operate your own electric fleet and charge it using purchased grid electricity | The electricity-generation emissions are your Scope 2 |
The distinction between Categories 4 and 9 is worth understanding.
Category 4 covers transportation and distribution services purchased by the reporting company. This includes certain inbound and outbound logistics services.
Category 9 generally covers the transportation and distribution of sold products where the reporting company does not pay for the transportation.
The truck itself does not determine the category. The nature of the transaction and the reporting organisation's relationship to the activity matter.
This also explains why emissions from the same physical activity can appear in more than one company's inventory. A logistics provider reports its fuel combustion under Scope 1. Its customer generally reports the purchased transportation service under Scope 3.
This overlap is expected in corporate inventories. Each organisation reports from its own perspective. However, overlapping company inventories should not be added together as though every reported tonne represents a separate physical emission.
The practical lesson: Define your organisational boundary before classifying emissions. Identify the entities, facilities and assets included in your inventory. Then assess the activities against that boundary and the relevant Scope 3 categories.
Why Scope 3 is the hardest data problem
Scope 1 and Scope 2 data generally comes from records held within your organisation.
Fuel logs, generator records, refrigerant records and electricity bills are usually available through facilities, operations or finance teams.
Scope 3 is different. Much of the required information sits with suppliers, logistics partners, employees and other value chain participants.
| Data required | Usually held by |
|---|---|
| Supplier and purchase records | Procurement |
| Freight and transportation records | Logistics |
| Employee commuting information | HR |
| Travel and expense records | Finance |
| Product and service emissions information | Suppliers and other value chain partners |
The information often sits in different systems, spreadsheets, inboxes and formats.
This creates five common challenges.
1. Limited supplier data
Many suppliers do not measure their emissions or have the information readily available.
2. Inconsistent formats
Different teams and suppliers share information in different units, reporting periods and templates. Consolidating it takes time.
3. Missing activity data
Purchase quantities, transportation distances and material specifications are often incomplete.
4. Different calculation methods
Teams might use different emission factors, assumptions or calculation approaches for similar activities.
5. Limited supporting evidence
An emissions figure might exist, but the organisation cannot show how it was calculated or which source documents support it.
The result is an inventory that is difficult to verify and harder to improve.
Scope 3 needs a structured approach to supplier engagement, data collection, calculation and review. A once-a-year spreadsheet exercise is rarely enough.
How are emissions calculated?
Across all three scopes, a commonly used calculation approach is:
Emissions = Activity Data × Emission Factor
Activity data tells you how much of an activity took place.
An emission factor estimates the greenhouse gas emissions associated with that activity.
| Scope | Typical activity data | Typical emission factor |
|---|---|---|
| Scope 1 | Litres of diesel or volume of natural gas burned | Fuel-specific emission factor |
| Scope 2 | kWh of electricity consumed | Grid factor or qualifying market-based factor |
| Scope 3 | Material quantities, transportation activity or supplier data | Material, transport or supplier-specific factor |
For example:
- Diesel consumption × relevant diesel emission factor.
- Electricity consumption × relevant grid emission factor.
- Quantity of purchased material × relevant material emission factor.
For some Scope 3 categories, organisations also use spend-based methods when physical activity or supplier-specific data is unavailable.
The appropriate method and emission factor depend on the activity, geography, reporting boundary and applicable accounting guidance.
Whatever method you use, record:
- The original data source.
- The activity data and units.
- The emission factor and its source.
- The calculation method.
- Any assumptions or estimates.
- The review and approval record.
Every reported number should have an explanation someone else can follow.
How to get started with your emissions inventory
You do not need every data point on day one. You need a structure you can repeat and improve with each reporting cycle.
1. Define your organisational boundary
List the entities, facilities and operations included in your inventory. Select an appropriate consolidation approach and apply it consistently.
2. Identify your emission sources
List the activities that generate direct and indirect emissions across your operations and value chain.
3. Map each source to a scope
Classify each source as Scope 1, Scope 2 or Scope 3. For Scope 3, identify the relevant category.
4. Assign data owners
Identify the teams responsible for each type of information.
For example:
- Facilities and operations for fuel and electricity.
- Finance for utility bills and travel expenses.
- Procurement for purchases and supplier information.
- HR for employee commuting.
- Logistics for freight and transportation.
5. Standardise data collection
Use consistent templates, units, reporting periods and calculation methods across facilities and departments.
6. Maintain supporting evidence
Keep bills, invoices, meter readings, supplier information, calculation sheets and approvals linked to the figures they support.
7. Review and improve
Check for missing information, unusual changes and inconsistent calculations. Identify where better data collection will make the biggest difference.
A final self-check
Pick any emissions figure in your inventory and ask:
Can you trace it back to the original activity data, emission factor and calculation method?
If the answer is no, start by improving your data ownership, collection and evidence process.
Where Karbon by Planet Sustech fits
Getting Scope 1, Scope 2 and Scope 3 right takes more than calculating a final CO₂e figure.
You need a way to collect activity data from multiple teams and facilities, apply relevant emission factors, review calculations and maintain supporting evidence.
Karbon by Planet Sustech brings these activities into one ESG data management platform.
With Karbon, organisations can:
- Track Scope 1, Scope 2 and Scope 3 emissions.
- Collect data through manual entry, bulk Excel uploads and APIs.
- Manage multiple facilities and reporting locations.
- Apply emission factors and calculate emissions.
- Identify missing data and reporting gaps.
- Maintain supporting information for review.
- Analyse emissions across reporting periods and facilities.
This helps sustainability teams move from scattered spreadsheets towards a more organised and traceable emissions management process.
The takeaway
Scopes describe your relationship to an emissions source, not simply where the activity happens.
Scope 1 covers direct emissions from sources within your organisational boundary.
Scope 2 covers emissions associated with purchased energy you consume.
Scope 3 covers other indirect emissions across your value chain.
That is why the same truck can sit in different scopes for different companies, and why defining your organisational boundary must come before calculating emissions.
An emissions inventory is only as reliable as the data behind each number.
Building your emissions inventory?
Bring your emissions data, facilities and reporting processes into one structured system.
Planet Sustech helps organisations measure, monitor and manage emissions across Scope 1, Scope 2 and Scope 3.
Frequently Asked Questions
1. What is the difference between Scope 1, Scope 2 and Scope 3 emissions?
Scope 1 covers direct emissions from sources within an organisation's boundary. Scope 2 covers indirect emissions from generating purchased or acquired energy consumed by the organisation. Scope 3 covers all other indirect emissions across its upstream and downstream value chain.
2. Is electricity consumption Scope 1 or Scope 2?
Purchased electricity consumed by an organisation falls under Scope 2. The associated emissions occur during electricity generation, not at the point where the organisation uses the electricity.
3. Are company vehicles Scope 1 or Scope 3?
Fuel burned in vehicles within an organisation's boundary generally falls under Scope 1. Transportation services purchased from a third-party logistics provider generally fall under Scope 3 for the customer and Scope 1 for the provider.
4. Can the same emissions appear in two companies' inventories?
Yes. Each organisation reports emissions from its own perspective. For example, a power plant reports emissions from generating electricity under Scope 1, while the organisation consuming that purchased electricity reports the associated emissions under Scope 2. This overlap is expected in corporate inventories.
5. What are the 15 categories of Scope 3 emissions?
The 15 categories are purchased goods and services; capital goods; fuel- and energy-related activities; upstream transportation and distribution; waste generated in operations; business travel; employee commuting; upstream leased assets; downstream transportation and distribution; processing of sold products; use of sold products; end-of-life treatment of sold products; downstream leased assets; franchises; and investments.
6. Which scope is usually the largest?
It depends on the industry, business model and value chain. For some manufacturers, purchased materials or the use of sold products account for a significant share of emissions. For other organisations, purchased electricity or direct fuel use might be larger.
7. Is Scope 3 reporting mandatory?
There is no single universal requirement for every organisation. Applicability depends on the reporting framework, regulatory requirements, listing obligations and other commitments that apply to the organisation.
8. How do companies calculate Scope 1, Scope 2 and Scope 3 emissions?
Companies use activity data and relevant emission factors to estimate greenhouse gas emissions. Examples include fuel consumption, electricity usage, purchased material quantities and transportation activity. The method depends on the emissions category and available data.
9. Why is Scope 3 difficult to measure?
Much of the required data sits outside the organisation, with suppliers, logistics partners, employees and customers. Collecting consistent, complete and reliable information across these groups is a major challenge.
Sources
- GHG Protocol, Corporate Accounting and Reporting Standard
- GHG Protocol, Corporate Value Chain (Scope 3) Standard
- GHG Protocol, Scope 2 Guidance
- GHG Protocol, Technical Guidance for Calculating Scope 3 Emissions, Category 4
- US Environmental Protection Agency, Determine Organizational Boundaries
- Scope 1 vs Scope 2 vs Scope 3
- Scope 1
- Scope 2
- Scope 3
- GHG Protocol
- Carbon Accounting
- ESG Reporting
- Sustainability
- Emissions Measurement
- GHG Emissions
Want to go further?
Talk to Our ESG TeamKeep reading
All articles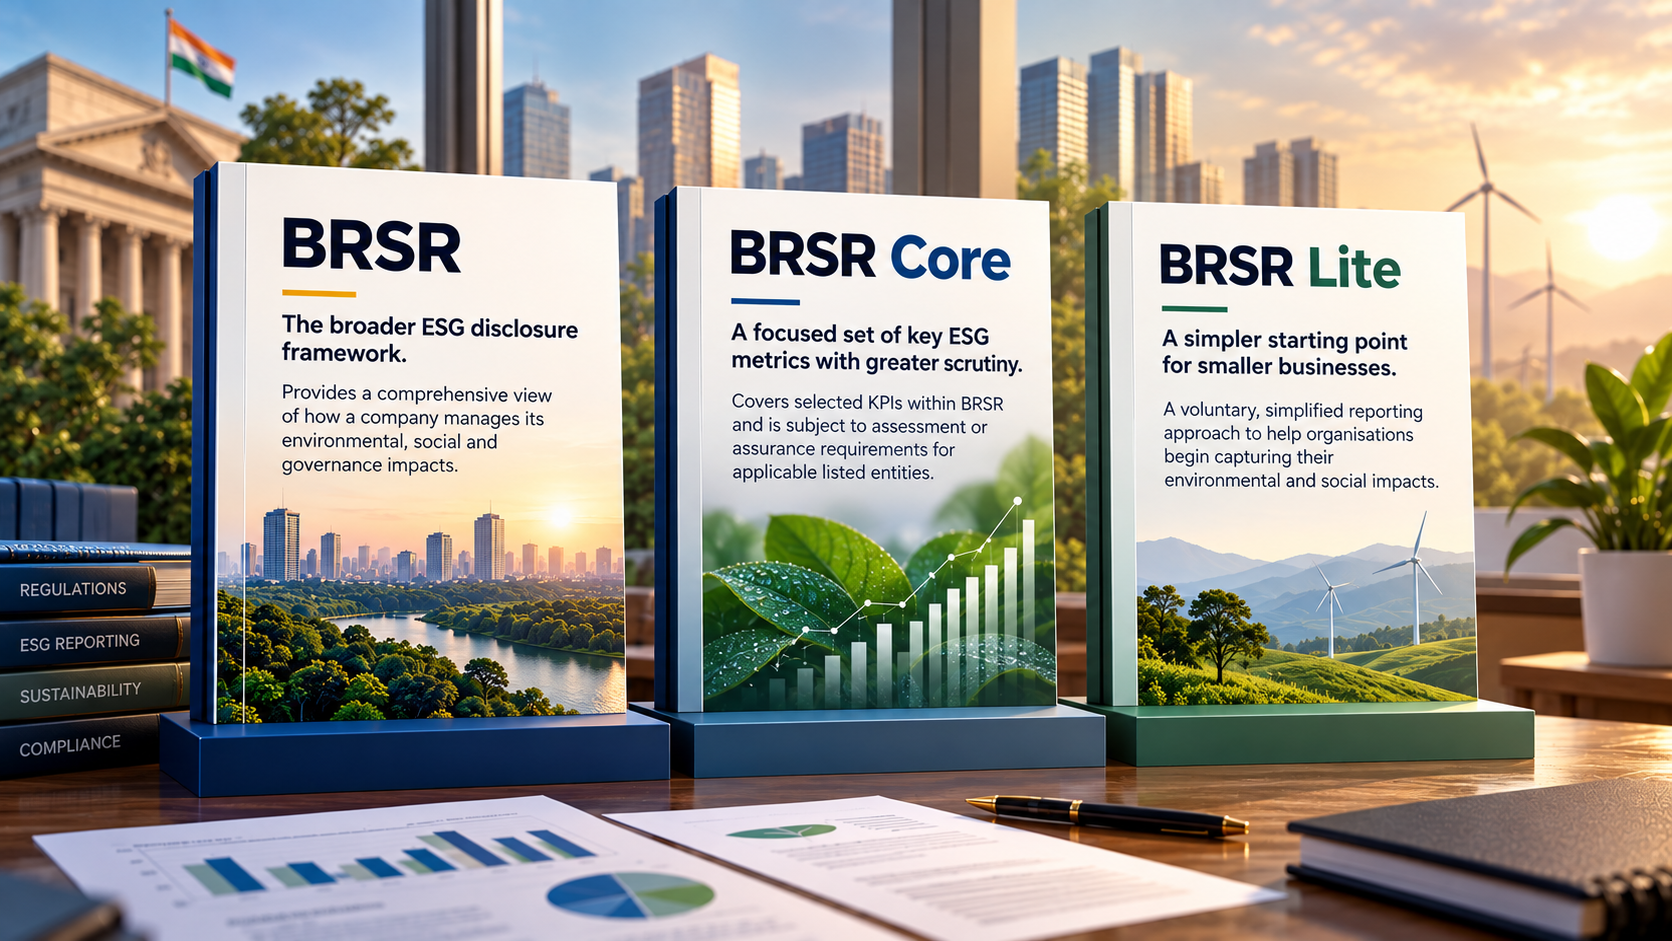 Compliance & RegulationsSep 28, 2026 · 9 min read
BRSR vs BRSR Core vs BRSR Lite: What’s the Real Difference?
BRSR, BRSR Core or BRSR Lite? Understand the key differences, applicability, reporting requirements and what Indian businesses need to prepare for.
 Sector RealitySep 21, 2026 · 7 min read
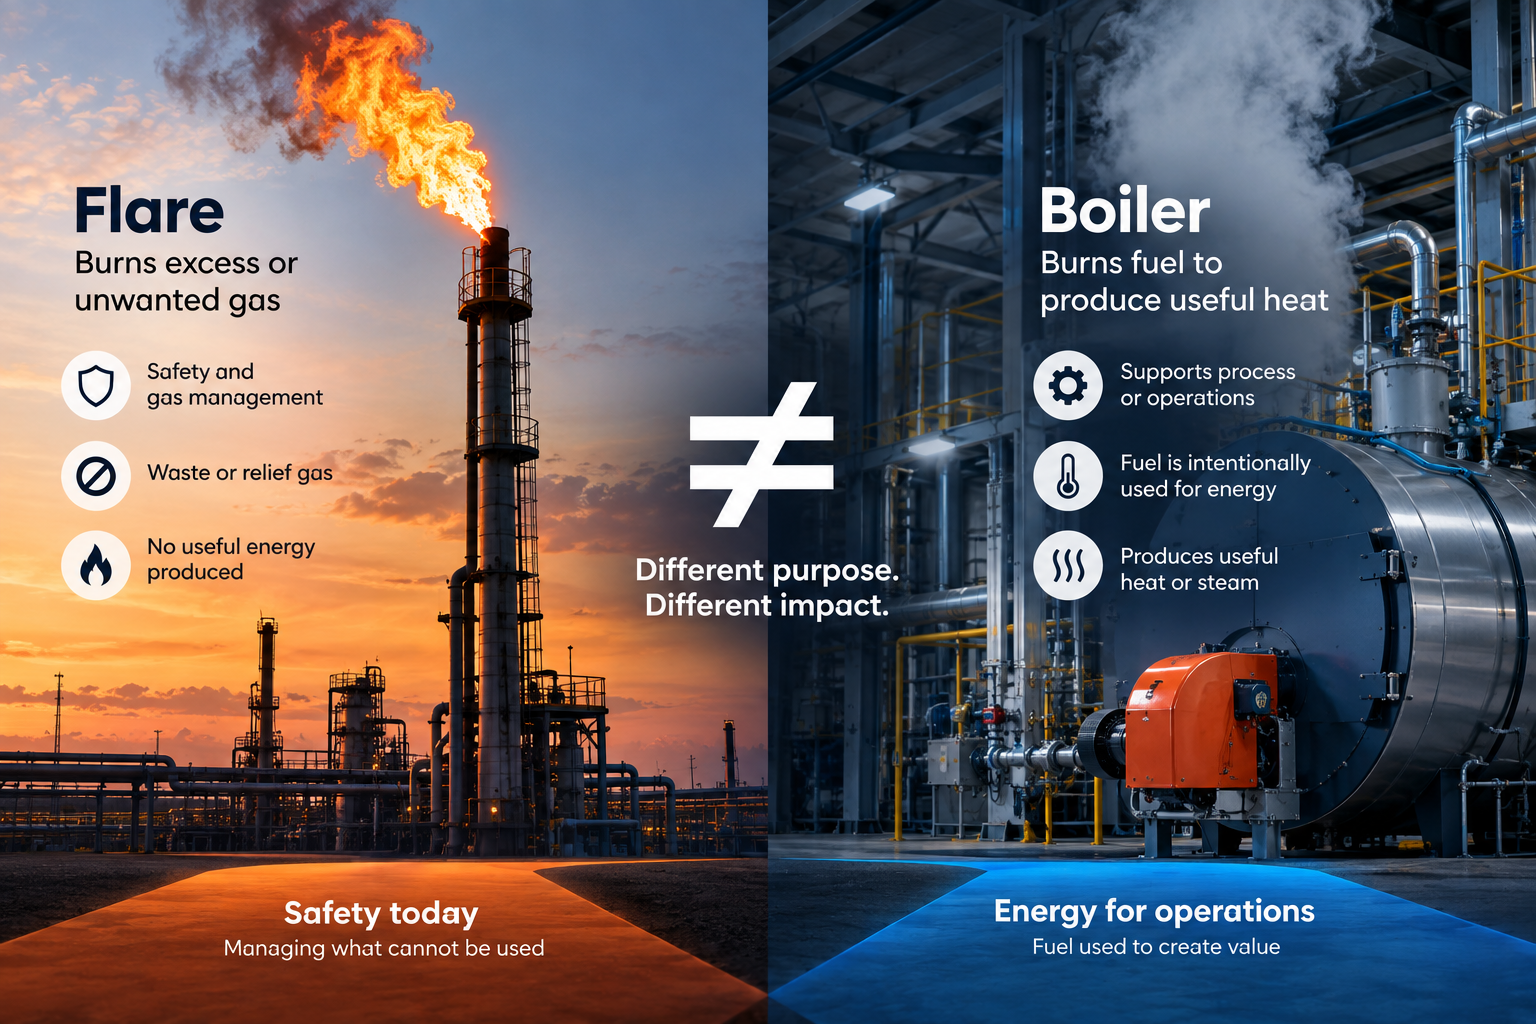
Oil & Gas: A Flare Is Not a Boiler
Flaring gets attention, but sold-fuel emissions can be much larger. Understand the flare vs boiler distinction and what it means for Oil & Gas reporting.
 ESG Reporting & RegulationsSep 7, 2026 · 8 min read
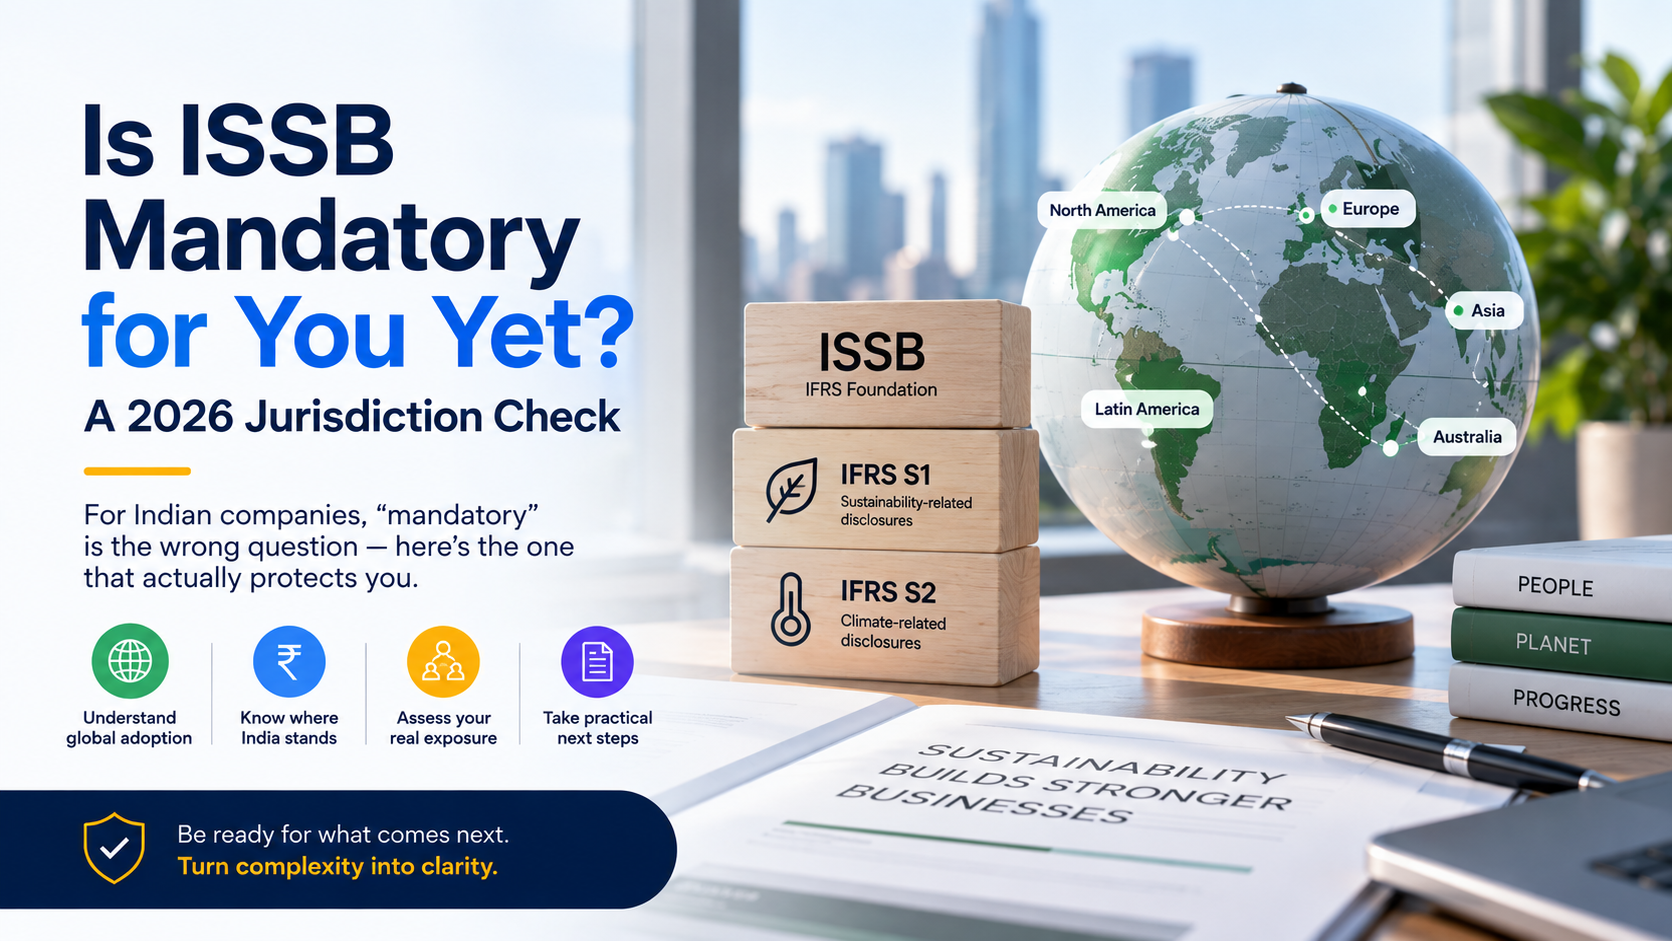
Is ISSB Mandatory for You Yet? A 2026 Jurisdiction Check
Is ISSB mandatory for your company in 2026? Understand India's BRSR position, global ISSB adoption and how to assess your company's exposure.